

WAN Latency Calculator
Select units and enter the values, then hit TAB or click anywhere outside of the text boxes.
About this WAN Latency Calculator
This Wide Area Network (WAN) Latency Calculator estimates the theoretical network latency between two locations based on the physical distance and properties of fibre-optic connection.
It calculates latency primarily from signal propagation delay, which is the time it takes for light to travel through fibre. Additional factors such as real-world cable routing, local access loops, and network equipment delays can also be included to provide a more realistic estimate.
The final result is displayed as round-trip time (RTT) - the total time for a packet to travel from source to destination and back.
Note: This calculator estimates baseline network path latency only. Real application latency may be higher due to protocol overhead, routing delays, congestion, queuing, or packet retransmissions.
How to Use
Follow these steps to estimate WAN latency:
- Enter the distance between sites in either miles (mi) or kilometres (km) (change units as required). Use actual fibre route distance if known, otherwise use straight-line distance as a starting point.
- The fibre path adjustment allows you to account for additional length due to cable routing. A typical value is around 5-15%, but it can be higher in areas with difficult terrain.
- The local loop length accounts for the distance from the sites to the corresponding fibre access points. This is often around 10-50 miles (15-80 km) but can vary widely based on location and provider. Enter the combined total for both sites. The value will be added to the distance between sites.
- The speed of light in fibre is typically around 124 miles per millisecond (200 km/ms). In most cases, leave default value unchanged unless modeling specific fibre types or wavelengths, as speed can vary.
- The equipment latency accounts for processing delays in network devices. A common estimate is around 1 millisecond, but it can be higher for multiple routers/switches or complex WAN paths. This value is added to the fibre path latency.
After entering the values, hit TAB or click anywhere outside of the text boxes to calculate the estimated round-trip time (RTT) in milliseconds. RTT includes: forward path delay, return path delay, and equipment latency.
Cloud Latency Tools
Major cloud providers publish region-to-region latency data and testing tools that measure real-world network performance across their global backbones.
Azure latency statistics
Microsoft web site lists network round-trip latency statistics between Azure regions. The published latency data are based on the median of multiple measurements taken over a period of time. The actual latency can vary based on factors such as time of day, network congestion, and routing changes. For the most accurate latency information, it is recommended to perform your own measurements using test virtual machines deployed in the regions of interest in your Azure subscription.
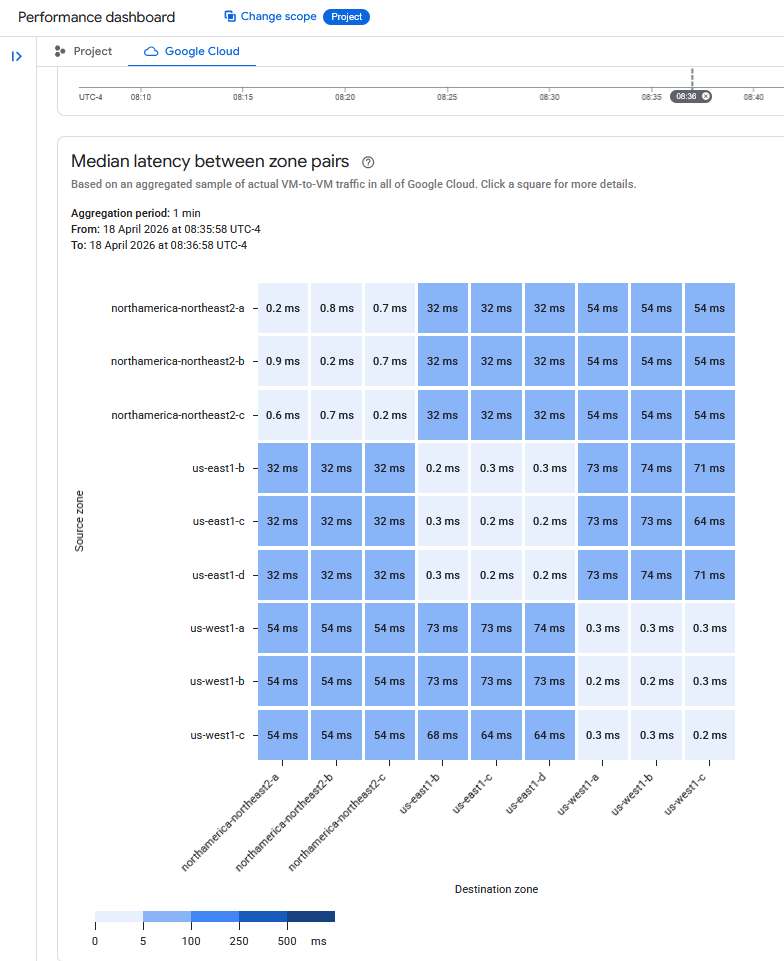
Google Cloud latency dashboard
The GCP Performance dashboard provides latency measurements between Google Cloud regions and from Google Cloud to various global locations. The dashboard can be accessed from the Network Intelligence Center in the Google Cloud Console and allows you to evaluate network performance for your applications and services hosted on Google Cloud.
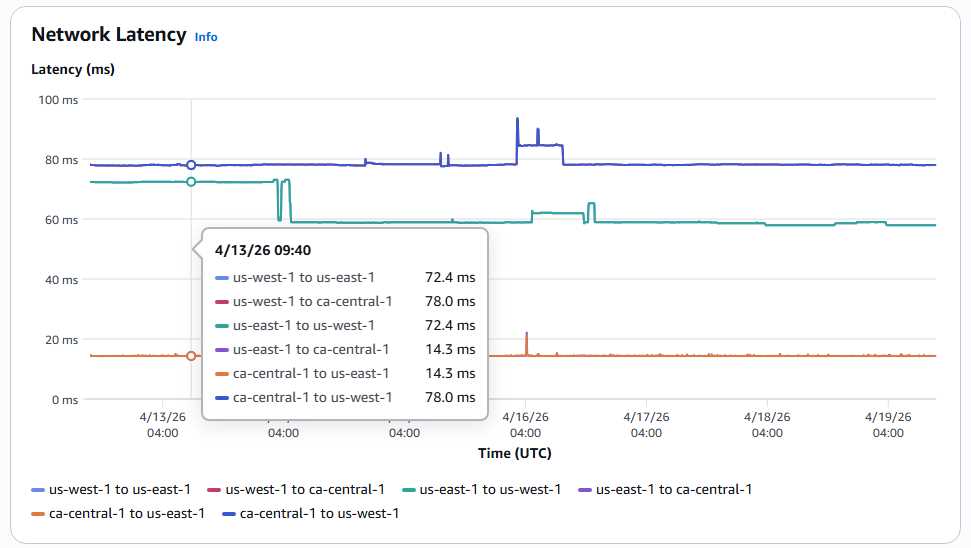
AWS infrastructure performance dashboard
The Infrastructure Performance dashboard under AWS Network Manager can be used to view real-time and historical aggregate network latency. It allows to monitor inter-region, inter-availability zone (AZ), and intra-AZ latency metrics.
See also:
Network throughput calculator...
How fast does light travel through a fibre optic cable?
The Interconnection Database (PeeringDB)
TeleGeography - Maps
Lumen Technologies (formerly Level 3) Network Map